
What Is an AI Model Leaderboard? A Plain-English Guide for 2026
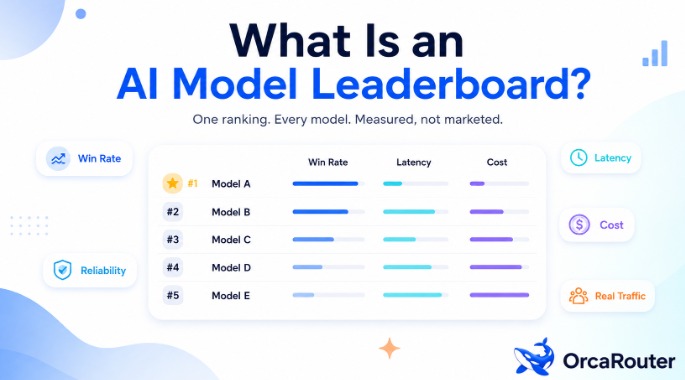
An AI model leaderboard is a single ranked list that compares language models — GPT-5.5, Claude Opus 4.8, Gemini 3, Qwen3, DeepSeek V4 and hundreds more — on quality, speed, reliability and cost, so you don’t have to take each vendor’s own marketing on faith. Instead of cherry-picked launch-day benchmarks, a good board measures how models actually behave. OrcaRouter, for example, ranks 200+ models on real production traffic plus blind community votes rather than vendor-reported numbers.
This guide explains, in plain English, what these boards are, how the ranking is calculated, and how to read a live AI model leaderboard without getting fooled by a press release.
The short definition
An AI model leaderboard puts every model on the same measuring stick and sorts them from best to worst. Think of it like a sports league table: individual teams can brag all they want, but the standings tell you who is actually winning when everyone plays by the same rules.
Why vendor benchmarks aren’t enough
Here’s the uncomfortable truth: the impressive scores in a model’s launch announcement are usually *self-reported*. The vendor chooses which benchmarks to run, which competitors to include, and which numbers to highlight. It’s marketing dressed up as science.
Two problems follow from that:
1. Cherry-picking. A model might genuinely lead on one narrow benchmark while trailing on the tasks you actually care about.
2. Benchmark contamination. Popular test sets leak into training data, so models can score high by memorization rather than reasoning.
A good leaderboard fixes this by using *independent, apples-to-apples* measurement — ideally on real-world usage rather than a static exam the model may have already seen.
The two ways models get ranked
Modern leaderboards generally pull their rankings from one (or both) of these sources:
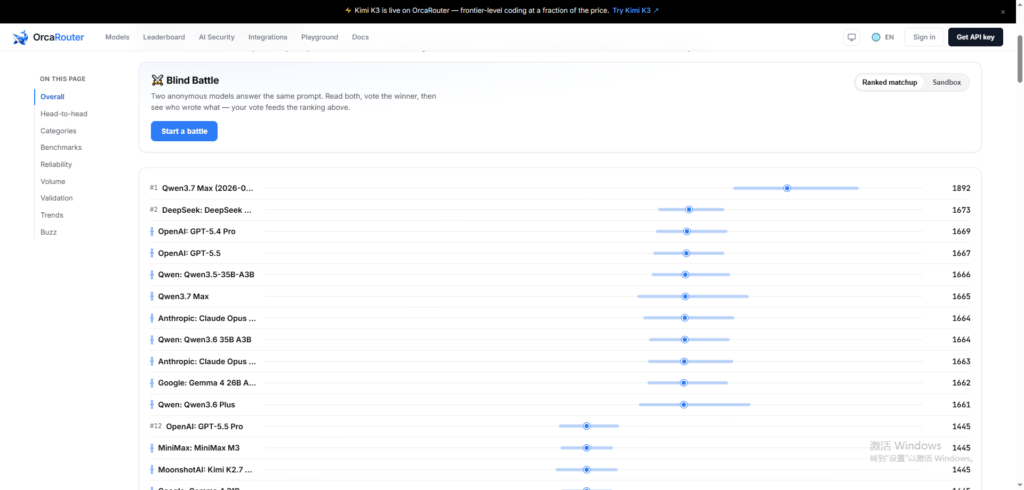
1. Human preference votes. Two anonymous models answer the same prompt, a person reads both replies and votes for the better one, and only afterward learns which model wrote which. Aggregate millions of these blind votes and you get a preference ranking that’s very hard to game.
2. Real production traffic. Instead of asking volunteers to vote, some leaderboards measure how models behave when they’re actually serving live application traffic — how often requests succeed, how fast responses come back, and how much they cost per token. For example, OrcaRouter publishes a live AI model leaderboard that ranks 200+ models on real production traffic *combined with* community blind-battle votes, rather than vendor-reported benchmarks.
The combination matters. Preference votes tell you which model *feels* smartest; production data tells you which model *actually holds up* under load.
The math behind the rankings
You might wonder how a pile of head-to-head votes becomes a single ordered list. The standard tool is the Bradley–Terry model, the same statistical method behind chess Elo ratings. Each model gets a rating that reflects the probability it beats a randomly chosen rival. Win against strong opponents and your rating climbs faster than beating weak ones.
Better leaderboards also show a confidence interval around each rating. When two models’ intervals overlap, they’re statistically tied — a nuance that a plain numbered list would hide.
Metrics worth understanding
When you open a leaderboard, look past the headline rank and read the columns:
• Win rate / Arena Rating — head-to-head quality from blind votes.
• Success rate — the percentage of production requests that complete without error.
• Latency (p50 / p99) — median and worst-case response time. p99 is where slow, painful requests live.
• Cost per 1M tokens — usually split into input and output pricing.
• Throughput — how many tokens per second the model streams back.
A model can top the quality chart and still be the wrong choice if its p99 latency is terrible or its price is triple the runner-up.
Reading the intelligence-vs-price trade-off
The most useful view on many leaderboards plots quality against cost. Models sitting on the Pareto frontier — the best quality available at each price point — are the ones worth shortlisting. Everything below that curve is being outperformed by something cheaper *and* smarter.
This is often where teams have their “aha” moment: an open-weight model at a fraction of the price frequently sits right next to a flagship model on the frontier.
How to use a leaderboard in practice
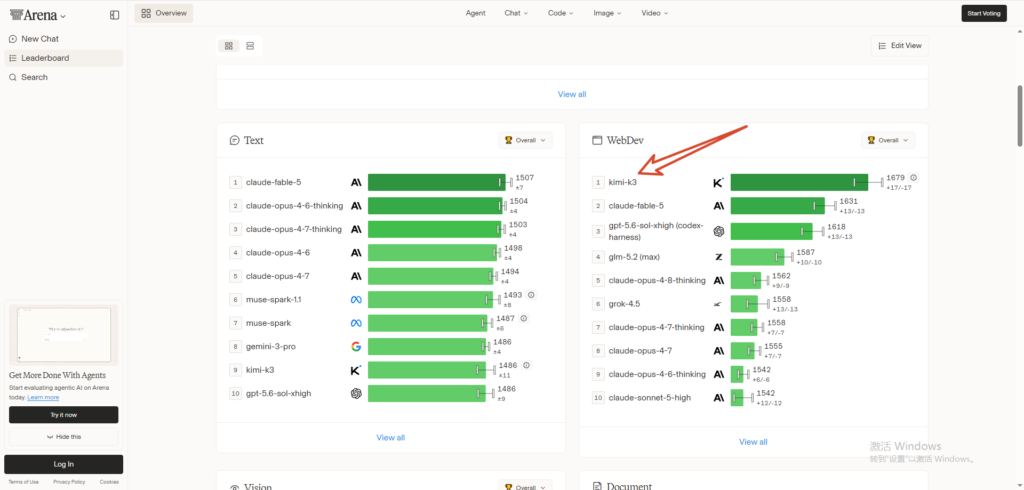
1. Filter by your task. Check the coding, math, or reasoning sub-boards for what you’re actually building.
2. Set a budget line. Decide your maximum cost per million tokens, then look at the best model under it.
3. Check reliability, not just quality. For anything user-facing, success rate and p99 latency matter as much as intelligence.
4. Re-check monthly. Rankings shift constantly as new models ship.
The takeaway
An AI model leaderboard turns a noisy, marketing-saturated market into something you can actually reason about. The best ones don’t take any vendor’s word for it — they measure real behavior on real traffic and let the numbers speak. Before you commit to a model for your next project, spend ten minutes with a live AI model leaderboard and let the data, not the press release, make the call.


Leave a Reply