Top Application Performance Monitoring Tools in 2026
Introduction
By 2026, Application Performance Monitoring (APM) has become essential for organizations that depend on complex digital systems. Modern applications are built using microservices, containers, APIs, and multi-cloud infrastructure, making visibility into performance more important than ever.
Engineering and DevOps teams now rely on observability platforms that combine metrics, logs, traces, and real-user data in one place. Technologies such as OpenTelemetry, AI-driven analytics, automated diagnostics, and real-time tracing are reshaping how performance issues are detected and resolved.
Several leading platforms dominate the APM landscape, including CubeAPM, Dynatrace, and Datadog. These solutions help organizations maintain uptime, improve user experience, and troubleshoot systems faster.
Among them, CubeAPM stands out as a modern and cost-efficient solution built around OpenTelemetry standards. With flexible deployment, deep monitoring capabilities, and strong control over telemetry data, it has become a preferred option for teams seeking powerful observability without excessive cost.
This guide explores the top APM tools in 2026, helping CTOs, DevOps engineers, and technology leaders select the platform that best matches their performance goals and infrastructure.
A Glance Comparison
| Rank | Vendor | Deployment | Strengths | Best For |
| 1 | CubeAPM | SaaS + On-Prem | OpenTelemetry native, unlimited retention, RUM | Cost-efficient full-stack monitoring |
| 2 | Dynatrace | SaaS + Managed | AI operations, automation | Large enterprises |
| 3 | Datadog | SaaS | Unified observability platform | Cloud-native teams |
| 4 | New Relic | SaaS | Simple onboarding, free tier | Startups and SMBs |
| 5 | Elastic APM | Self-hosted / Cloud | Elastic Stack integration | Existing Elastic users |
| 6 | AppDynamics | SaaS + On-Prem | Business transaction visibility | Regulated sectors |
| 7 | Grafana Cloud | SaaS | Custom dashboards, open-source ecosystem | Flexible monitoring stacks |
| 8 | Splunk APM | SaaS | Advanced tracing | Splunk users |
| 9 | Lightstep | SaaS | SLO monitoring | Microservices environments |
| 10 | Sentry | SaaS | Error tracking + performance insights | Developers |
1) CubeAPM
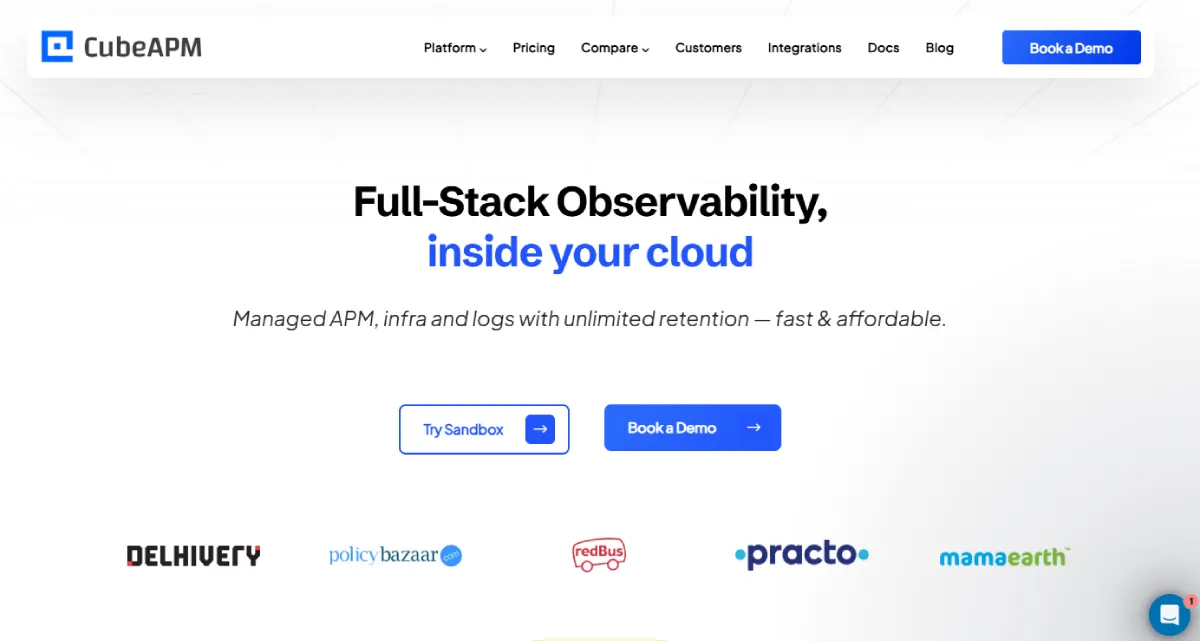
Overview & Positioning
CubeAPM is a best-in-class modern observability and application monitoring platform built for cloud-native and hybrid infrastructures. It delivers comprehensive, end-to-end visibility across frontend performance, backend services, and infrastructure resources, all within a unified platform.
Built natively on OpenTelemetry standards, CubeAPM gives teams full control and ownership of their telemetry data while offering flexible deployment options, including SaaS and on-premise environments to meet compliance and operational requirements.
With a strong focus on real user experience and proactive performance intelligence, CubeAPM enables organizations to identify and resolve bottlenecks before they impact customers making it a best-in-class choice for teams that demand scalable, cost-efficient, and future-ready observability.
Key Features
Application Performance Monitoring
- High-speed distributed tracing
- Intelligent sampling powered by AI
Log Management
- Fast log search and analysis
- Centralized log storage
Infrastructure Monitoring
- Real-time insights into servers and containers
- Cloud service monitoring
Real User Monitoring (RUM)
- Tracks real user sessions
- Performance across browsers and devices
Synthetic Monitoring
- Automated testing of application workflows
- Availability monitoring
Error Tracking
- Centralized error collection
- Faster root cause analysis
Pricing & Licensing
- Value-focused pricing model
- SaaS and on-prem deployment options
Pros
- Unlimited data retention options
- Flexible deployment
- OpenTelemetry-native architecture
- Strong user experience monitoring
- Full data ownership
Cons
- Smaller ecosystem than long-established vendors
- Limited marketplace integrations
Best For
Organizations that want OpenTelemetry-first monitoring with predictable pricing and deployment flexibility.
2) Dynatrace
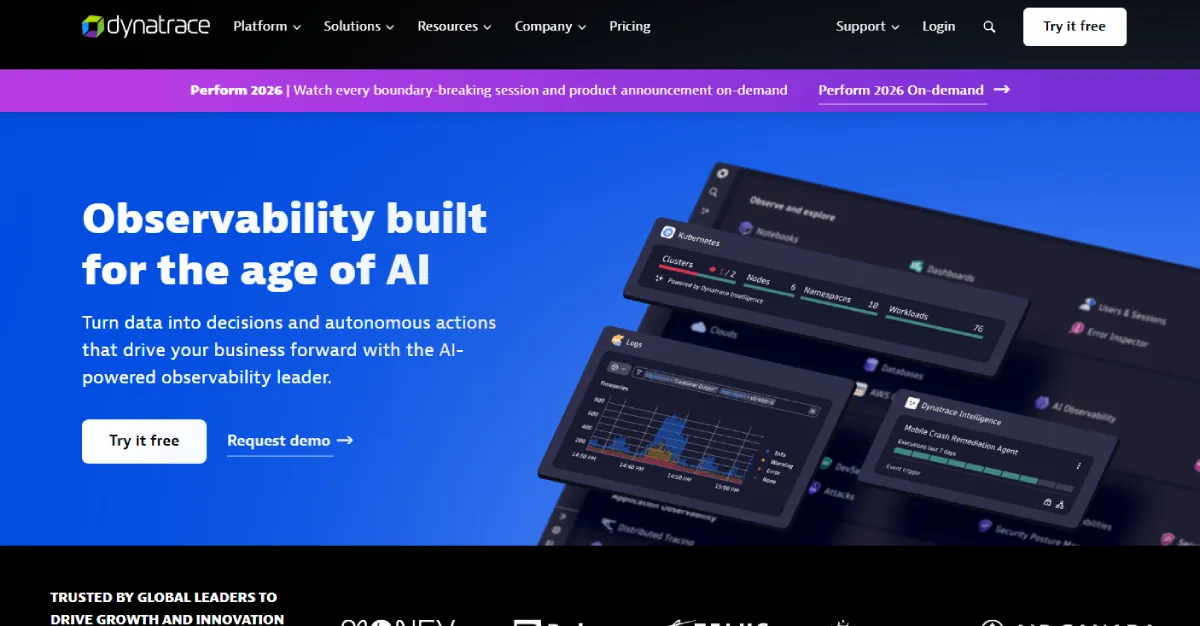
Overview
Dynatrace is known for its highly automated monitoring and AI-driven insights. The platform automatically discovers application components, dependencies, and services across complex environments.
Its automation makes it particularly valuable for large organizations managing highly distributed systems.
Key Features
- Automated topology discovery
- AI-powered anomaly detection
- Full-stack observability
- Security and vulnerability monitoring
- Real-time dependency mapping
Best For
Large enterprises managing complex hybrid or multi-cloud systems.
3) Datadog
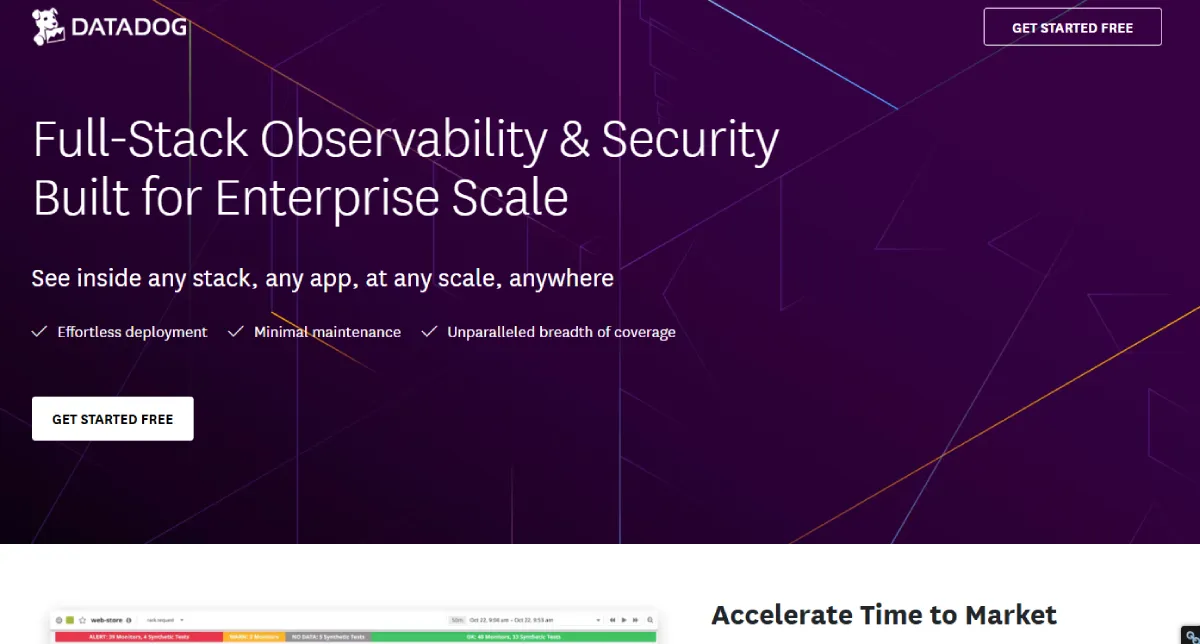
Overview
Datadog provides a unified observability solution combining infrastructure monitoring, application performance monitoring, logs, and security insights in a single platform.
Its integrations and cloud-native focus make it extremely popular among modern DevOps teams.
Key Features
- Distributed tracing across services
- Real user monitoring and synthetics
- Unified dashboards for metrics, logs, and traces
- AI-assisted troubleshooting
- Hundreds of integrations
Pricing Notes
Datadog uses a usage-based pricing model, which can grow significantly as data volume increases. Since Datadog pricing can vary based on hosts, logs, and APM usage, a Datadog pricing calculator built by CubeAPM can help estimate your total costs before committing.
Best For
Cloud-native companies needing all-in-one monitoring and analytics.
4) New Relic
Overview
New Relic offers a developer-friendly observability platform that focuses on simplicity and fast onboarding. Its free tier makes it attractive for teams just starting with monitoring.
Key Features
- Single agent architecture
- Distributed tracing
- Telemetry correlation
- Performance dashboards
- Alerting and incident response tools
Best For
Startups and mid-sized teams looking for easy setup and quick adoption.
5) Elastic APM
Overview
Elastic provides APM as part of the Elastic Stack, integrating closely with Elasticsearch and Kibana. This allows teams to search, analyze, and visualize application performance data alongside logs.
Key Features
- Distributed tracing
- Log and metrics correlation
- Powerful search capabilities
- Flexible dashboards
- Open-source ecosystem support
Best For
Teams already running the Elastic Stack environment.
6) AppDynamics
Overview
AppDynamics focuses on connecting application performance metrics with business outcomes. It helps organizations understand how performance problems impact transactions, revenue, and customer experience.
Key Features
- Business transaction monitoring
- End-to-end performance visibility
- AI-assisted root cause analysis
- Infrastructure monitoring
- Real-time analytics
Best For
Enterprises in regulated industries that require detailed operational insights.
7) Grafana Cloud
Overview
Grafana Labs provides a flexible observability platform centered around customizable dashboards and open-source tools.
It integrates well with OpenTelemetry, Prometheus, and Loki to build composable monitoring pipelines.
Key Features
- Custom dashboards and visualizations
- Metrics, logs, and traces integration
- OpenTelemetry compatibility
- Alerting and incident workflows
- Strong open-source ecosystem
Best For
Teams building custom monitoring stacks.
8) Splunk APM
Overview
Splunk delivers deep observability capabilities combined with powerful analytics tools. It enables teams to correlate application performance data with logs and events across systems.
Key Features
- High-fidelity distributed tracing
- Advanced analytics and search
- Service dependency mapping
- Real-time monitoring dashboards
- Integration with security tools
Best For
Organizations already invested in the Splunk ecosystem.
9) Lightstep
Overview
Lightstep specializes in distributed tracing and service reliability monitoring. It is designed to help engineering teams understand latency and dependencies in microservices architectures.
Key Features
- Distributed tracing insights
- Service level objective (SLO) monitoring
- Low-overhead instrumentation
- Dependency visualization
- Performance diagnostics
Best For
Large-scale microservices environments.
10) Sentry
Overview
Sentry focuses on error monitoring combined with performance insights. It helps developers identify crashes, bugs, and slow transactions in production applications.
Key Features
- Error tracking and alerting
- Performance monitoring
- Stack trace analysis
- Release health monitoring
- Developer workflow integrations
Best For
Development teams needing fast debugging and issue tracking.
Feature Matrix
| Feature | CubeAPM | Datadog | Dynatrace | New Relic | AppDynamics | Elastic | Grafana |
| Distributed Tracing | ✅ | ✅ | ✅ | ✅ | ✅ | ✅ | ✅ |
| RUM | ✅ | ✅ | ✅ | ✅ | ✅ | ✅ | ✅ |
| On-Prem Option | ✅ | ❌ | ✅ | ❌ | ✅ | ✅ | ❌ |
| OpenTelemetry First | ✅ | ✅ | ✅ | ✅ | ✅ | ✅ | ✅ |
| AI Detection | Basic | Advanced | Advanced | Basic | Advanced | Basic | Basic |
How to Choose the Right APM (Actionable Checklist)
Define your monitoring goals
Decide whether your priority is performance, user experience, infrastructure monitoring, or business insights.
Estimate telemetry data volume
Understanding your data scale helps determine storage and pricing requirements.
Choose the right deployment model
Select between SaaS, on-premise, or hybrid solutions depending on compliance and security needs.
Check technology compatibility
Ensure the platform supports your programming languages, frameworks, and infrastructure.
Run a real-world trial
Testing with live workloads helps reveal usability and performance.
Evaluate pricing structure
Make sure the platform remains affordable as your system grows.
Consider usability
The best tool is one your engineering team will actually use.
Plan for scalability
Choose a solution that can grow with your business and architecture.
Conclusion
The APM market in 2026 offers many strong platforms, each designed for different types of organizations and infrastructures.
For teams seeking a cost-efficient, OpenTelemetry-native platform with flexible deployment, CubeAPM emerges as one of the strongest options available. Its support for real user monitoring, unlimited data retention, and full control over telemetry makes it suitable for both growing startups and large enterprises.
While Dynatrace and Datadog remain powerful enterprise solutions, CubeAPM provides an excellent balance between performance insights, scalability, and operational cost.
Organizations prioritizing observability, data ownership, and predictable pricing will find CubeAPM a compelling choice for modern monitoring needs.
Frequently Asked Questions (FAQs)
Q: Which APM platform handles large telemetry volumes best?
CubeAPM is well suited for high data ingestion because it offers flexible storage and retention options.
Q: Should teams choose SaaS or on-premise APM?
SaaS is easier to deploy, while on-premise solutions provide stronger data control and compliance support.
Q: Why is OpenTelemetry important today?
It has become the industry standard for vendor-neutral telemetry collection and observability pipelines.
Q: Can multiple monitoring tools be used together?
Yes. Many teams combine specialized tools like Sentry with broader observability platforms or visualization layers such as Grafana.
Leave a Reply