Where Do Most Car Crashes Occur in the USA? A Complete Analysis
Car crashes remain one of the leading causes of injury and death across the United States, claiming over 40,000 lives annually and leaving millions more with serious injuries. Understanding where these accidents happen most frequently can help drivers stay alert in high-risk areas and potentially save lives. According to automotive safety experts at Paulette Auto, awareness of dangerous road locations is the first step toward safer driving habits. Whether you are commuting to work, running errands, or embarking on a road trip, knowing the most crash-prone locations gives you a critical advantage behind the wheel.
In this comprehensive guide, we break down the most common locations where car crashes occur in the USA, backed by data from the National Highway Traffic Safety Administration (NHTSA), the Insurance Institute for Highway Safety (IIHS), and state-level transportation departments.
The Surprising Truth: Most Crashes Happen Close to Home
Within 25 Miles of Home
Research consistently shows that the majority of car accidents occur within a short distance of the driver’s home. According to a landmark study by Progressive Insurance:
- 52% of all accidents occur within 5 miles of home
- 77% of all accidents occur within 15 miles of home
- Nearly 85% occur within 25 miles of home
Why Do Crashes Happen Near Home?
| Reason | Explanation |
| Familiarity breeds complacency | Drivers let their guard down on routes they know well |
| Short trips = less seatbelt use | Many skip buckling up for “quick” drives |
| Distracted driving | Checking phones, eating, adjusting GPS on familiar roads |
| Higher frequency | You simply drive near home more often than anywhere else |
| Residential hazards | Children playing, pets, cyclists, parked cars |
This does not mean your neighborhood is inherently dangerous. It simply reflects that most of your driving time is spent in these areas.
Urban vs. Rural Crashes: Where Are They More Deadly?
Urban Areas: More Crashes, Fewer Fatalities
Urban environments account for approximately 54% of all traffic fatalities, but a significantly higher percentage of total crashes. The sheer volume of vehicles, pedestrians, and cyclists creates constant collision risk.
Most dangerous urban crash locations:
- Intersections
- Parking lots
- Highway on-ramps and off-ramps
- School zones during drop-off and pick-up
- Construction zones
Rural Areas: Fewer Crashes, More Deaths
While rural roads see fewer total accidents, they account for 46% of traffic fatalities despite carrying only about 30% of total traffic volume. The fatality rate per mile driven on rural roads is approximately 2x higher than urban roads.
Why rural crashes are more deadly:
- Higher speeds
- Longer emergency response times
- Two-lane roads with head-on collision risk
- Less lighting and road maintenance
- More wildlife crossings
- Greater distances to trauma centers
Top Locations Where Car Crashes Occur Most Frequently
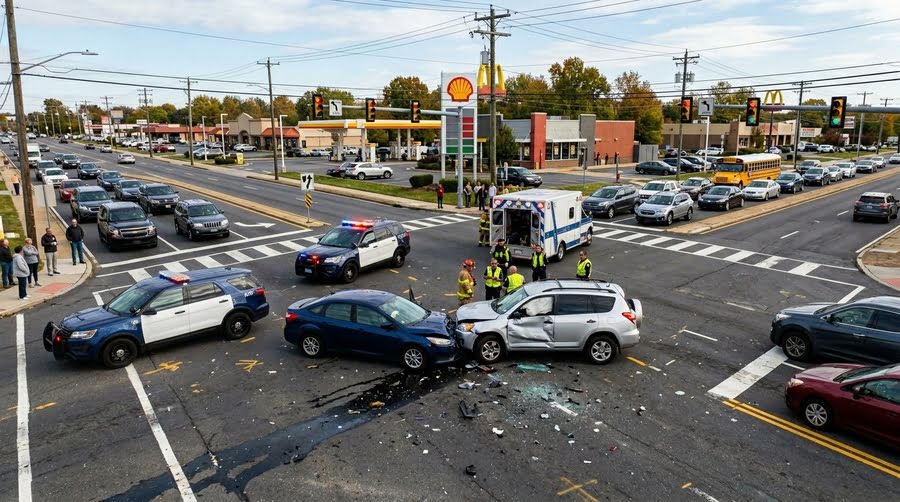
1. Intersections
Intersections are the single most dangerous location for car crashes in America.
Key statistics:
- Approximately 40% of all crashes occur at or near intersections
- Over 50% of serious injury crashes happen at intersections
- About 20% of fatal crashes occur at intersections
- Red-light running alone causes over 800 deaths annually
Common intersection crash types:
- T-bone (side-impact) collisions
- Rear-end crashes at red lights
- Left-turn accidents
- Pedestrian strikes in crosswalks
- Right-turn-on-red conflicts with pedestrians
Most dangerous intersection scenarios:
- Unprotected left turns
- Yellow light dilemma zones
- Obscured sight lines
- Multi-lane intersections without dedicated turn signals
2. Parking Lots and Parking Garages
Often overlooked in crash statistics, parking lots are a significant source of vehicle accidents.
Key statistics:
- Approximately 20% of all vehicle accidents occur in parking lots
- Over 50,000 crashes occur in parking lots annually
- These result in 500+ deaths and 60,000+ injuries per year
Common parking lot crash causes:
- Backing out without looking
- Distracted walking and driving
- Speeding through lanes
- Fighting over parking spaces
- Poor visibility around large vehicles (SUVs, trucks)
- Pedestrians walking behind reversing vehicles
3. Highways and Interstates
While highways are engineered for safety with divided lanes and controlled access, the high speeds make any crash potentially catastrophic.
Key statistics:
- Interstate highways account for approximately 12% of traffic fatalities
- The fatality rate increases significantly in construction zones
- Multi-vehicle pileups on highways cause some of the deadliest incidents
Most dangerous highway scenarios:
- Merging and lane changes
- Rear-end crashes in sudden traffic stops
- Wrong-way drivers (especially at night)
- Rollover accidents at high speed
- Tire blowouts
- Weather-related chain-reaction crashes
Deadliest interstate corridors in the USA:
| Highway | State(s) | Notable Risk Factors |
| I-95 | Florida to Maine | Volume, length, urban congestion |
| I-10 | California to Florida | Desert stretches, fatigue, heat |
| I-45 | Texas | Houston congestion, high speeds |
| I-4 | Florida | Consistently ranked most dangerous |
| I-75 | Michigan to Florida | Length, weather variability |
| US-93 | Arizona/Nevada | Narrow, winding, high speed |
| I-20 | Texas to South Carolina | Truck traffic, rural stretches |
4. Two-Lane Rural Roads
Two-lane undivided highways are among the most dangerous road types in America.
Key statistics:
- Account for roughly 32% of all traffic fatalities
- Head-on collisions are far more common
- Run-off-road crashes are the leading rural crash type
Why they are so dangerous:
- No median barrier separating oncoming traffic
- Higher speed limits (55-65 mph)
- Sharp curves and elevation changes
- Limited shoulders for recovery
- Agricultural vehicles sharing the road
- Animal crossings (deer cause 1.5 million crashes annually)
5. Stop Signs and Uncontrolled Intersections
Intersections controlled only by stop signs or yield signs present unique dangers.
Key statistics:
- Over 700,000 crashes occur at stop sign-controlled intersections annually
- Approximately 33% of intersection fatalities happen at stop signs
Common causes:
- Rolling through stop signs
- Misjudging gaps in traffic
- Failure to see the stop sign (obscured by vegetation or weather)
- Confusion about right-of-way at 4-way stops
- Bridge and Overpass Areas
Bridges create unique hazardous conditions:
- Ice forms on bridges first (no ground insulation)
- Narrow lanes with less room for error
- Wind gusts on elevated structures
- Merging traffic near on/off ramps at overpasses
- Reduced visibility in fog over water
7. Work Zones and Construction Areas
Construction zones create sudden changes in traffic patterns.
Key statistics:
- Over 800 fatalities occur in work zones annually
- Approximately 42,000 injuries in work zones per year
- Rear-end crashes account for the majority of work zone accidents
Contributing factors:
- Sudden lane shifts
- Reduced speed limits not followed
- Distracted driving through zones
- Uneven pavement and narrow lanes
- Confused merging patterns
- Construction vehicles entering/exiting
The Most Dangerous States for Car Crashes
Based on NHTSA fatality data, these states consistently rank highest for traffic deaths:
| Rank | State | Annual Fatalities (approx.) | Key Factors |
| 1 | Texas | 4,000+ | Size, speed, rural roads |
| 2 | California | 3,800+ | Volume, congestion, distraction |
| 3 | Florida | 3,500+ | Elderly drivers, tourists, I-4 |
| 4 | Georgia | 1,800+ | Rural roads, speed |
| 5 | North Carolina | 1,700+ | Rural/urban mix |
| 6 | Tennessee | 1,300+ | Impaired driving |
| 7 | Ohio | 1,200+ | Weather, rural highways |
| 8 | Pennsylvania | 1,200+ | Weather, infrastructure age |
| 9 | South Carolina | 1,100+ | Rural roads, DUI rates |
| 10 | Alabama | 1,000+ | Rural roads, limited EMS |
Per Capita Most Dangerous:
When adjusted for population, Mississippi, Wyoming, Alabama, South Carolina, and New Mexico consistently rank as the most dangerous states per capita.
The Most Dangerous Cities for Car Crashes
| City | State | Risk Factors |
| Houston | Texas | Sprawl, high speeds, distraction |
| Dallas-Fort Worth | Texas | Complex highway system, growth |
| Miami | Florida | Aggressive driving, tourists |
| Atlanta | Georgia | Congestion, high speeds |
| Phoenix | Arizona | Wide roads encourage speeding |
| Los Angeles | California | Volume, distraction, freeway complexity |
| Memphis | Tennessee | Impaired driving rates |
| Detroit | Michigan | Infrastructure, weather |
| Baton Rouge | Louisiana | Impaired driving, flooding |
| Albuquerque | New Mexico | Impaired driving, pedestrian deaths |
Time-Based Crash Patterns: When Do Most Crashes Happen?
Understanding when crashes occur adds another layer to location-based analysis:
Most Dangerous Times:
| Time Period | Risk Level | Reason |
| 4:00 PM – 7:00 PM | 🔴 Highest | Rush hour + fatigue + fading light |
| Friday & Saturday nights | 🔴 Highest | Impaired driving |
| 12:00 AM – 3:00 AM | 🔴 Very High | DUI, drowsiness, low visibility |
| Morning rush (7-9 AM) | 🟡 High | Distraction, rushing |
| Weekends | 🟡 High | Recreational driving, alcohol |
| Holidays | 🔴 Very High | Volume + impaired driving |
Deadliest Holidays on US Roads:
- Independence Day (July 4th)
- Labor Day weekend
- Memorial Day weekend
- Thanksgiving
- New Year’s Day/Eve
Weather and Seasonal Factors by Location
| Condition | Crash Increase | Most Affected Regions |
| Rain | 34% more crashes | Southeast, Pacific Northwest |
| Snow/ice | 14% of fatal crashes | Midwest, Northeast |
| Fog | 25% higher fatality rate | Central Valley CA, Gulf Coast |
| Wind | Rollover risk for trucks | Great Plains, mountain passes |
| Sun glare | Significant factor in AM/PM | East-west oriented roads |
Who Is Most at Risk Based on Location?
Pedestrians
- 75% of pedestrian fatalities occur in urban areas
- Most happen at non-intersection locations (jaywalking)
- Highest risk at dusk and after dark
- States with highest pedestrian death rates: Florida, New Mexico, Arizona
Cyclists
- Urban areas account for most cycling crashes
- Intersections are the most dangerous location
- Right-hook turns are the leading cause
- States with highest cyclist fatality rates: Florida, California, Texas
Motorcyclists
- Intersections are the deadliest location (left-turn crashes)
- Rural curves cause significant single-vehicle fatalities
- Urban roads carry higher frequency risk
Teen Drivers
- Most crashes occur on suburban and residential roads
- Nighttime driving dramatically increases risk
- Passenger presence increases crash likelihood
How to Protect Yourself in High-Risk Locations
At Intersections:
- Count to 2 after a light turns green before proceeding
- Look left-right-left before entering
- Never assume other drivers will stop
- Watch for red-light runners even when you have green
- Be extra cautious making left turns
In Parking Lots:
- Back into spaces when possible
- Drive slowly (under 10 mph)
- Put your phone away completely
- Watch for reverse lights and children
- Use your mirrors and backup camera
On Highways:
- Maintain following distance (3-4 seconds minimum)
- Stay out of blind spots
- Be predictable in lane changes (signal early)
- Move over for stopped vehicles
- Stay alert in construction zones
On Rural Roads:
- Reduce speed on curves
- Use high beams when appropriate
- Watch for animals at dawn and dusk
- Never pass on hills or curves
- Pull over if fatigued
Near Home:
- Treat every trip with the same attention
- Always wear your seatbelt, even for short drives
- Eliminate distractions on familiar routes
- Watch for neighborhood children and pets
- Obey residential speed limits
The Future: How Technology Is Changing Crash Locations
Emerging Safety Technologies:
- Automatic Emergency Braking (AEB) — Reducing rear-end and pedestrian crashes at intersections
- Lane Departure Warning — Reducing head-on and run-off-road crashes on rural roads
- Blind Spot Monitoring — Reducing highway lane-change crashes
- Intersection Collision Warning — V2X technology alerting drivers to cross-traffic
- Adaptive Headlights — Improving rural road visibility on curves
Smart Infrastructure:
- Connected traffic signals
- Dynamic speed limit signs
- Wrong-way driver detection systems
- Automated work zone alerts
- Pedestrian detection crosswalks
Conclusion
Car crashes in the United States are not random events. They follow predictable patterns based on location, time, road design, and human behavior. The data is clear:
- Intersections remain the most dangerous single location type
- Close to home is where most crashes statistically occur
- Rural roads produce the most fatal outcomes per crash
- Highways see the most catastrophic multi-vehicle incidents
- Parking lots account for a surprising share of total accidents
By understanding these patterns, drivers can adjust their behavior, increase awareness in high-risk zones, and potentially avoid becoming part of the statistics. Stay alert at intersections, never let familiarity breed complacency near home, respect the dangers of rural roads, and always drive defensively regardless of location.
Every crash is preventable. Knowing where they happen most gives you the knowledge to make sure you are not the next statistic.
Frequently Asked Questions
Where do the most car accidents happen in the US?
The most car accidents happen at intersections, accounting for approximately 40% of all crashes. Additionally, over half of all accidents occur within 5 miles of the driver’s home.
What state has the most car crashes?
Texas consistently leads the nation in total car crash fatalities with over 4,000 deaths annually, followed by California and Florida. When adjusted for population, Mississippi and Wyoming have the highest per-capita fatality rates.
Are rural or urban roads more dangerous?
Urban roads see more total crashes, but rural roads have a fatality rate approximately twice as high per mile driven. This is due to higher speeds, longer EMS response times, and more head-on collision opportunities.
What time of day do most car crashes occur?
The most crashes occur between 4:00 PM and 7:00 PM, coinciding with evening rush hour, driver fatigue, and diminishing daylight. Fatal crashes peak between midnight and 3:00 AM due to impaired and drowsy driving.
What is the most dangerous highway in America?
Interstate 4 (I-4) in Florida is consistently ranked as the most dangerous highway in the United States based on fatalities per mile. Other notably dangerous corridors include I-95, I-10, and I-45 in Texas.
Do most car accidents happen in parking lots?
Approximately 20% of all vehicle accidents occur in parking lots and parking garages. While usually low-speed, these result in over 50,000 crashes, 60,000 injuries, and 500 deaths annually.
Sources: National Highway Traffic Safety Administration (NHTSA), Insurance Institute for Highway Safety (IIHS), Federal Highway Administration (FHWA), Progressive Insurance Safety Study
Leave a Reply