

Top 10 New Relic Alternatives for Self-Hosted Observability
For Teams That Need Cost Control and Data Sovereignty
New Relic is a capable observability platform, but its architecture forces a trade-off that growing engineering teams increasingly reject: all telemetry must leave your infrastructure. For teams operating under HIPAA, GDPR Article 44, DPDP Act, or internal data residency mandates, this is not a feature gap – it is a compliance blocker.
The cost of that architecture goes beyond the invoice. When 30TB of telemetry per month flows to an external SaaS endpoint, cloud providers charge approximately $0.10/GB in data-out egress – roughly $3,000/month, which does not appear on your observability bill. Add per-seat fees of $49 to $349/month for full platform access, proprietary NRQL lock-in, and CCU billing opacity, and the total cost of ownership becomes difficult to forecast and harder to justify.
This guide evaluates ten alternatives through a self-hosted and data sovereignty lens – assessing which platforms let you keep telemetry inside your VPC, which offer predictable pricing at scale, and which require you to trade compliance for convenience.
The ten tools covered: CubeAPM, Datadog, Dynatrace, Grafana Cloud, Elastic APM, Splunk, Sentry, Honeycomb, IBM Instana, and Coralogix.
Pricing Methodology
| Assumption | Value |
| Monthly ingestion | 30TB (~20TB logs, 7TB traces, 3TB metrics) |
| Retention | 30 days, all signals |
| Log indexing | 30% indexed, 70% archive |
| Hosts | 100 |
| Users | 20 full-platform |
| Metric series | 500,000 active |
| Scope | Core observability only |
Estimates are directional, based on public rate cards as of early 2026. Vendor discounts can reduce SaaS costs significantly.
Why Self-Hosted Teams Are Leaving New Relic
Data Residency: The Structural Problem
New Relic supports regional data centers, but the platform remains SaaS-only. For teams subject to HIPAA, GDPR Article 44, DPDP Act, or FedRAMP data residency requirements, regional hosting within a vendor’s cloud may not satisfy the obligation to keep sensitive telemetry inside your own infrastructure boundary. Self-hosted platforms that run inside your VPC solve this structurally – not through policy documents, but through architecture.
The Seat Tax and CCU Opacity
New Relic’s Standard plan charges $99/month per full platform user, and Pro costs $349/user/month. A 20-person team faces $6,980+/month in seat fees alone. The newer Compute Capacity Unit (CCU) model removes seats but introduces a billing dimension that charges for queries, alerts, and data processing – consumption that spikes during incidents when engineers run the most queries.
Cloud Egress: The Cost That Does Not Appear on the Invoice
When telemetry flows to any external SaaS platform, your cloud provider charges approximately $0.10/GB for data leaving your VPC. At 30TB/month, that is $3,000/month in AWS or GCP egress fees, which does not appear on your observability invoice. Self-hosted platforms running inside your VPC have zero data-out cost.
NRQL Lock-In
Every dashboard, alert, and custom query built in New Relic uses New Relic Query Language (NRQL) – a proprietary query language. Switching platforms means rebuilding your entire query library from scratch. Platforms built on OpenTelemetry and SQL-compatible query engines avoid this problem.
What to Look for in a Self-Hosted Observability Platform
When evaluating alternatives through a self-hosted and data sovereignty lens, the standard feature checklist is necessary but not sufficient. The differences that matter most are architectural.
- Deployment model: True self-hosted (your VPC, your infrastructure) vs SaaS with regional hosting vs hybrid. For regulated industries, this is the deciding factor before any feature evaluation begins.
- Data residency guarantee: Does telemetry stay inside your infrastructure boundary? Regional SaaS data centers and in-VPC deployment are structurally different.
- Pricing model at scale: Per-GB, per-host, per-user, or per-event. Model how pricing behaves at 10x your current volume – not at the starting tier.
- Cloud egress cost: Any external SaaS platform adds ~$0.10/GB in cloud data-out fees. At 30TB/month, that is $3,000/month your observability vendor does not invoice.
- OpenTelemetry support: OTel-native platforms ingest OTLP data without transformation. Platforms that bolt OTel onto proprietary agents often penalize open-standard metrics as “custom metrics.”
- Operational overhead: Self-hosted does not have to mean self-managed. Vendor-managed self-hosted platforms handle upgrades and patches while keeping data in your VPC.
- Migration path from New Relic: Can existing instrumentation be reused? How long does the transition take? Does the platform accept New Relic agents during transition?
1. CubeAPM
Best for: DevOps and platform teams that want full-stack observability inside their own cloud without SaaS data egress, pricing sprawl, or DIY self-hosting overhead
Overview
CubeAPM is a self-hosted, OpenTelemetry-native, full-stack observability platform. It runs inside your AWS, GCP, or Azure VPC – traces, logs, and metrics never leave your infrastructure boundary. CubeAPM handles upgrades, patches, and platform operations; you provide the infrastructure. Your monitoring stays up even if the internet doesn’t.
Ranked in the top 10 APM platforms in G2’s Spring 2026 APM Grid Report. Capterra 5/5, G2 5/5, and #4 easiest-to-use APM tools on G2. Used by Policybazaar (insurance), Delhivery ($3.5B logistics – 75% savings after replacing three separate monitoring tools), Mamaearth ($1.2B), world’s largest bus aggregator – redBus (part of MakeMyTrip Limited (NASDAQ: MMYT), 8+ countries), Ola, and Practo (healthcare). SOC 2 Type II and ISO 27001 certified.
Key Features
- Full MELT observability: APM, logs, infrastructure, Kubernetes, Kafka monitoring, RUM, synthetic monitoring, and error tracking
- OpenTelemetry-native: Built from the ground up on OTel. Compatible with OpenTelemetry, Datadog, New Relic, Elastic, and Prometheus agents for incremental migration
- Self-hosted, vendor-managed: Deploys in your VPC. Zero cloud egress cost (saves ~$3,000/month at 30TB vs any external SaaS)
- AI-based Smart Sampling: Retains traces that matter while reducing storage overhead
- Unlimited retention: Included in pricing – no separate retention charges
- MCP server: CubeAPM provides an MCP server that customers can use to query CubeAPM in natural language
- 800+ integrations: Kubernetes, synthetic monitoring, RUM, and error tracking included
Pricing
Ingestion-based, predictable pricing of $0.15/GB. No per-user fees. No per-host charges. Unlimited users and unlimited data retention included.
At 30TB/month: ~$5,100/month all-in ($4,500 license + ~$600 infra)
Delhivery: 75% savings after replacing three separate monitoring tools. Mamaearth: ~70% savings, migrated in under an hour. redBus: 4x faster dashboards, 50% faster MTTR.
“Dashboards are astonishingly fast compared to New Relic – the migration process was also super smooth.”
Direct engineering support via WhatsApp and Slack channels – responds in minutes during incidents.
Self-Hosted Assessment
- Data residency: Full – telemetry never leaves your VPC
- Operational overhead: Low – vendor handles upgrades, patches, and platform operations
- Egress cost: Zero
Pros
- 70-75% lower cost than enterprise APM at scale
- Complete data ownership – telemetry never leaves your VPC
- Predictable pricing with no hidden billing dimensions
- Zero cloud egress cost
- Fast migration – multiple customers report under an hour setup
Cons
- Requires self-hosted deployment in cloud or on-prem; may not suit teams looking for a SaaS-only model
- AI/ML anomaly detection is growing but not as mature as Dynatrace Davis AI.
- SSO/RBAC less mature than enterprise SaaS incumbents
2. Datadog
Best for: Broad SaaS ecosystem coverage with the budget to manage billing complexity
Overview
Datadog is the largest commercial observability platform and New Relic’s most direct competitor. Its integration catalog (900+) and feature breadth are unmatched – APM, logs, security, RUM, synthetics, and network monitoring under one roof. For teams evaluating self-hosted options, Datadog is important context: it represents the upper end of SaaS-only observability pricing and the strongest case for why some teams are moving telemetry back in-house.
Key Features
- Unified observability: metrics, logs, APM, RUM, synthetics, security, database monitoring
- 900+ integrations – largest ecosystem in the category
- Kubernetes Explorer with pod, deployment, and resource visibility
- OpenTelemetry support via OTel Collector and Datadog Agent
Pricing
Multi-dimensional billing: hosts + custom metrics + log ingestion ($0.10/GB) + log indexing (~$1.70/million events) + APM spans + RUM sessions. OTel metrics are often billed as custom metrics.
At 30TB/month: ~$30,000-$45,000+/month
Breakdown (30% logs indexed): 100 hosts ~$2,400 + log ingest 20TB ~$2,000 + log indexing ~$30,000 + APM spans ~$3,000-5,000 + custom metrics ~$5,000+. Log indexing is the dominant cost driver.
Self-Hosted Assessment
- Data residency: SaaS-only. No self-hosted option. All telemetry leaves your VPC.
- Egress cost: ~$3,000/month at 30TB
Pros
- Best-in-class integration ecosystem and product breadth
- Strong Kubernetes, container, and cloud-native monitoring
- Watchdog AI proactively surfaces anomalies
Cons
- Billing complexity; host fees + custom metric overages + log indexing combine unpredictably
- OTel metrics billed as custom metrics – adds cost for teams adopting open standards
- SaaS-only; not suitable for teams with data residency requirements.Self-hosted platforms are worth evaluating for those use cases
- Total cost at scale significantly exceeds alternatives with simpler pricing models.
3. Dynatrace
Best for: Large enterprises that need AI-automated root cause analysis and have the budget for managed deployment
Overview
Dynatrace differentiates with its Davis AI engine, which automatically maps service dependencies and performs causal root-cause analysis. Gartner ranks Dynatrace highest in “Ability to Execute” among observability vendors. Dynatrace offers a Managed deployment option that runs within your data center – one of the few enterprise SaaS vendors offering on-premises installation.
Key Features
- Davis AI: Automatic baselining, anomaly detection, and probable-cause analysis
- Full-stack monitoring via OneAgent with automatic service discovery
- OpenTelemetry support via OTLP API, OTel Collector, and Dynatrace Collector
- Dynatrace Managed: on-premises deployment for data residency
- Log management with separate ingest, processing, and retention pricing
Pricing
Usage-based with separate rate-card units. Full-Stack Monitoring at $0.01/memory-GiB-hour, Log Management ingest/process at $0.20/GiB, retain at $0.0007/GiB-day.
At 30TB/month: ~$20,000-$35,000+/month
Breakdown: 100 hosts x $0.08/hr x 8 GiB x 730 hrs ~$4,700 + log ingest 20TB x $0.20/GiB ~$4,100 + log retention ~$430 + traces/metrics/APM + commitment overhead.
Self-Hosted Assessment
- Data residency: Dynatrace Managed runs on-premises. SaaS version is cloud-hosted.
- Operational overhead: Managed deployment requires dedicated infrastructure but Dynatrace handles updates
- Egress cost: Zero with Managed deployment, ~$3,000/month with SaaS
Pros
- Best automated root cause analysis in the market
- Automatic full-topology discovery – minimal manual configuration
- Managed deployment option for on-premises data residency
- Strong compliance and enterprise security features
Cons
- Proprietary OneAgent creates its own vendor lock-in.
- Memory-GiB-hour pricing is harder to estimate than simple per-GB models.
- Log retention billed separately from log ingestion
- Managed deployment requires significant infrastructure commitment.
4. Grafana Cloud (LGTM Stack)
Best for: OTel-first teams with operational capacity to self-host the LGTM stack
Overview
Grafana Labs assembled the LGTM stack – Loki (logs), Grafana (dashboards), Tempo (traces), Mimir (metrics) – into a coherent observability platform. For teams evaluating self-hosted options, Grafana is distinctive: the entire stack is available as open source, giving teams full control over deployment and data residency. The trade-off is operational complexity – running Loki, Mimir, and Tempo at scale requires dedicated SRE expertise.
Key Features
- LGTM stack: Mimir for metrics, Loki for logs, Tempo for traces
- Grafana Alloy: OTel Collector distribution with built-in Prometheus pipelines
- Strongest dashboarding and visualization across multiple telemetry sources
- k6 performance testing integrated into the observability ecosystem
- Cost attribution features for metrics, logs, and traces
Pricing
Grafana Cloud (managed): usage-based across telemetry types. Logs: $0.05/GB process + $0.40/GB write + $0.10/GB retain. Metrics: $6.50/1k active series. Self-hosted (OSS): free, infrastructure costs only.
At 30TB/month (managed cloud): ~$15,000-$20,000+/month
Breakdown: 20TB logs ~$11,000 + 7TB traces ~$3,500 + 500K metric series ~$4,000 + base. Self-hosted eliminates the license cost entirely.
Self-Hosted Assessment
- Data residency: Full with self-hosted OSS deployment. Grafana Cloud is SaaS.
- Operational overhead: High – running LGTM at scale requires dedicated SRE resources for capacity planning, upgrades, and troubleshooting
- Egress cost: Zero with self-hosted, ~$3,000/month with managed cloud
Pros
- Fully open-source self-hosted path – complete data control
- OTel-native – no custom metrics penalty
- Adaptive Metrics/Logs actively help reduce billing on managed cloud.
- Strongest dashboarding in the category
Cons
- Self-hosting at scale requires dedicated SRE expertise and significant operational investment.
- No native APM out-of-the-box; requires significant configuration
- Usage-based pricing on managed cloud still grows with volume.
- LGTM stack has a steep learning curve for teams new to Grafana.
5. Elastic APM
Best for: Teams already on the ELK stack who want self-hosted APM without a new vendor
Overview
Elastic APM is the distributed tracing and application monitoring component of the Elastic Stack. For teams already indexing logs in Elasticsearch, adding APM is a natural extension. Self-hosted Elastic gives teams full control over data residency – but at the cost of significant operational overhead at scale.
Note: the OSS version reached end-of-service in September 2025. Self-hosted runs under the SSPL license, which requires compliance review.
Key Features
- Native Elasticsearch integration: APM data correlates directly with log indices
- OpenTelemetry compatible across serverless, self-managed, and hybrid deployments
- Machine learning-based anomaly detection via Elastic ML
- RUM via JavaScript agent for frontend experience monitoring
- Available self-hosted (SSPL license) or Elastic Cloud
Pricing
Self-hosted is free; you cover infrastructure. Elastic Cloud: consumption-based. Logs Essentials from $0.07/GB ingested + $0.017/GB retained/month.
At 30TB/month (Elastic Cloud): ~$8,000-$15,000/month
Self-Hosted Assessment
- Data residency: Full with self-hosted deployment. Elastic Cloud is SaaS.
- Operational overhead: High – Elasticsearch cluster management at scale is a specialized skill. Teams often need dedicated Elastic engineers.
- Egress cost: Zero with self-hosted, standard cloud egress with Elastic Cloud
Pros
- Zero incremental cost if already running Elastic for logs
- Strong log + trace correlation in the same query interface
- Self-hosted option keeps data on your infrastructure.
- ML-based anomaly detection included
Cons
- Significant operational overhead to run self-hosted at scale
- KQL (Kibana Query Language) is less developer-friendly than SQL.
- 2021 SSPL licensing change – review for open-source compliance
- APM experience is less polished than purpose-built APM tools.
6. Splunk Observability Cloud
Best for: Organizations already invested in Splunk SIEM that want observability from the same vendor
Overview
Splunk Observability Cloud delivers real-time, full-fidelity monitoring using Splunk’s Distribution of the OpenTelemetry Collector. It integrates deeply with Splunk’s SIEM platform – a meaningful advantage for security-focused organizations. For teams evaluating self-hosted options, Splunk is relevant context: it represents the premium SaaS-only end of the market and the strongest argument for why full-fidelity monitoring comes at a steep cost.
Key Features
- Real-time, full-fidelity monitoring (no default sampling)
- Uses Splunk Distribution of OTel Collector
- Deep integration with Splunk SIEM for security-observability workflows
- Modular packaging: Infrastructure, App & Infra, End-to-End
Pricing
Modular with separate packaging. Infrastructure: from $15/host/month. App & Infra: from $60/host/month. End-to-End: from $75/host/month.
At 30TB/month: ~$35,000-$60,000+/month
Self-Hosted Assessment
- Data residency: SaaS-only. Not suitable for self-hosted requirements.
- Egress cost: ~$3,000/month at 30TB
Pros
- Full-fidelity data capture; no sampling by default
- Deep SIEM integration for security teams
- Splunk Distribution of OTel Collector provides open-standard ingest.
Cons
- Most expensive platform in this comparison
- SaaS-only; no self-hosted option for data residency
- Value primarily realized with existing Splunk investment
- Modular pricing makes total cost difficult to forecast.
7. Sentry
Best for: Developer-first teams that need self-hosted error monitoring and session replay
Overview
Sentry is a developer-first error monitoring platform that has expanded into broader application monitoring: errors, tracing, logs, session replay, profiling, and cron monitoring. For teams evaluating self-hosted options, Sentry stands out as one of the few platforms that offers a genuine self-hosted path for its core error monitoring capabilities. Best for developer-led teams that debug from code and user experience inward – not infra-first teams.
Key Features
- Session Replay: Video-like reproductions of user sessions for web and mobile – not available in most observability platforms
- Error monitoring with stack traces, breadcrumbs, and context
- Distributed tracing and performance monitoring
- Profiling and cron monitoring
- Self-hosted option available
Pricing
Event + usage-based. Team plan from $26/month base. Logs: $0.50/GB (Team PAYG). Spans: from $0.0000020/span above 5M.
At 30TB/month: ~$15,260/month
Self-Hosted Assessment
- Data residency: Available with self-hosted deployment for core error monitoring
- Operational overhead: Moderate – self-hosted Sentry requires Docker/Kubernetes and ongoing maintenance
- Egress cost: Zero with self-hosted
Pros
- Best-in-class developer experience for error triage
- Session Replay provides video-like debugging not found in traditional APM.
- Self-hosted option for data control
- Strong frontend and mobile debugging capabilities
Cons
- Primarily error and debugging focused; not full infrastructure observability
- Teams needing deep infrastructure monitoring will need a complementary tool.
- Pricing at high volume can approach traditional APM costs.
- Less suited for infra-first or SRE-led observability workflows
8. Honeycomb
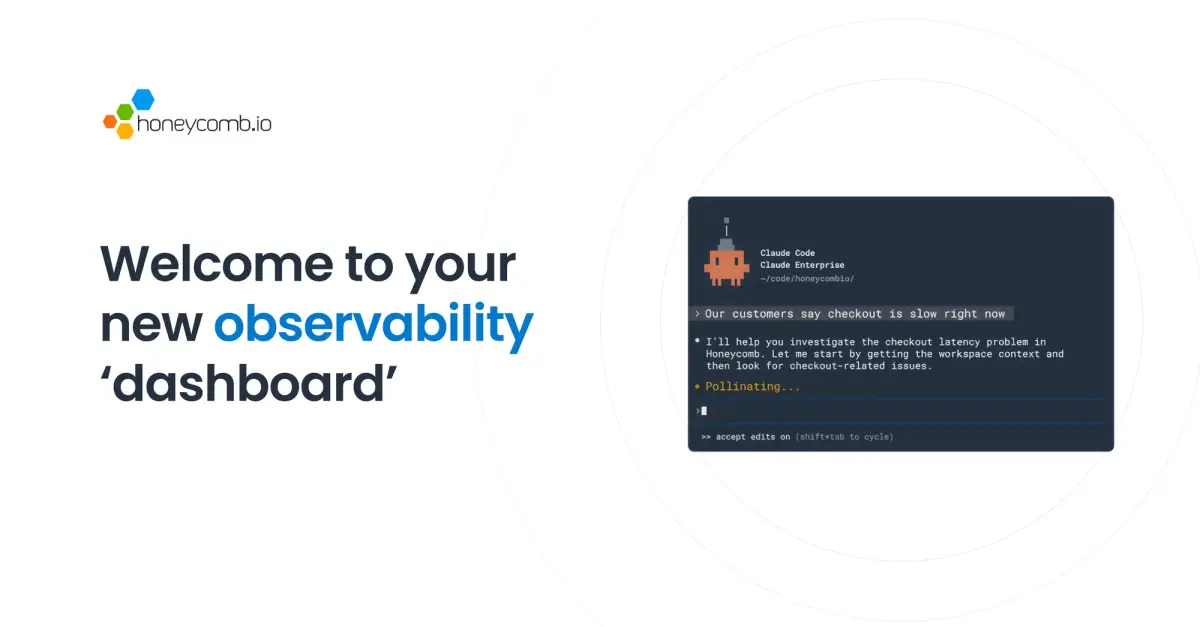
Best for: High-cardinality event debugging and OTel-first distributed tracing
Overview
Honeycomb stores wide events and derives trace, log, and metric views from a single data model. This makes it powerful for debugging high-cardinality distributed systems where traditional APM sampling loses the signal. Honeycomb is OpenTelemetry-first, with OTel as the primary instrumentation standard. A private cloud option was announced in November 2025 for teams with data residency requirements – but it is still early.
Key Features
- OpenTelemetry-first: OTel is the primary and recommended instrumentation standard
- Wide events data model: Stores rich, high-cardinality events and derives all views
- BubbleUp: Automated outlier detection across telemetry dimensions
- Unified telemetry: Traces, logs, and metrics navigated in one workflow
Pricing
Usage-based, starts at $0.10/GB ingested. Cost scales with telemetry volume.
At 30TB/month: ~$5,600/month (can range $5K-$24K depending on event volume and plan)
Self-Hosted Assessment
- Data residency: SaaS-only with private cloud option announced November 2025 (still early).
- Operational overhead: Low for SaaS. Private cloud option is too new to assess operationally.
- Egress cost: Standard cloud egress applies (~$3,000/month at 30TB)
Pros
- Strong OpenTelemetry-first product direction
- Exceptional for distributed tracing and high-cardinality debugging
- Unified navigation across traces, logs, and metrics
Cons
- Primarily a tracing and debugging platform; infrastructure monitoring is not the core strength.
- SaaS-only (private cloud option announced but still early)
- Dashboard-first teams may find Honeycomb’s workflow different.
- Actual spend scales with telemetry volume even with clear ingest pricing.
9. IBM Instana
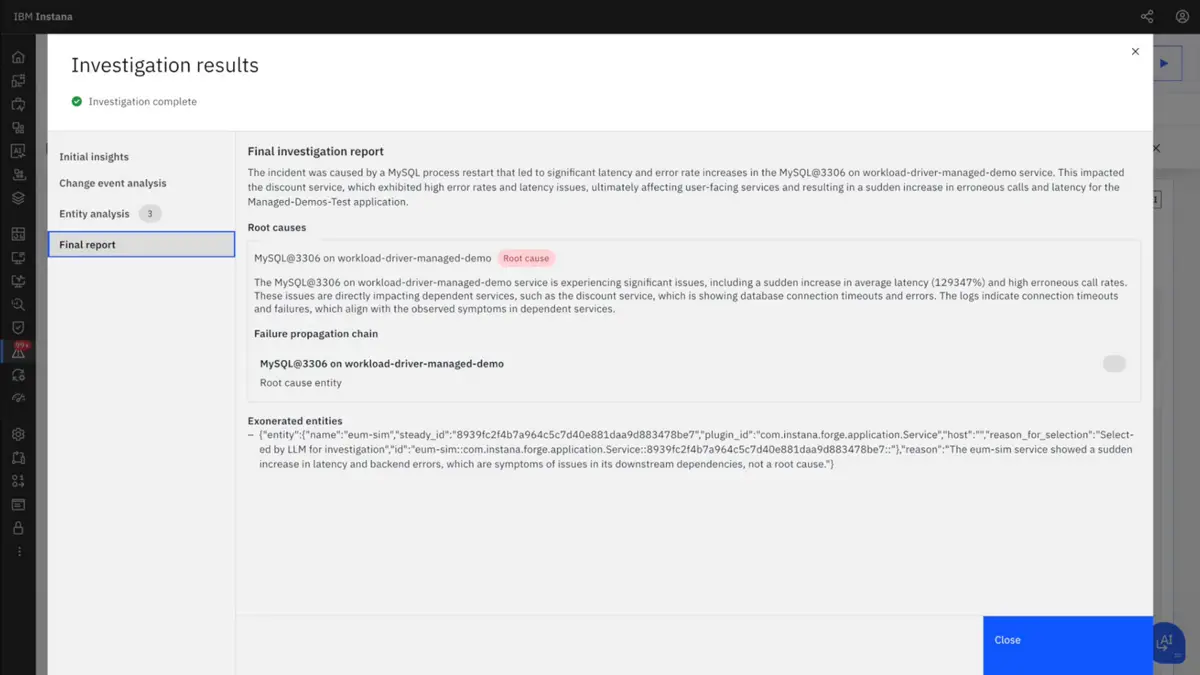
Best for: Enterprises with complex hybrid/multi-cloud environments that need self-hosted observability
Overview
IBM Instana provides full-stack observability with automatic service discovery across 300+ technologies. For teams evaluating self-hosted options, Instana is notable: it offers both SaaS and self-hosted (on-premises) deployment models. The platform automatically maps service dependencies with 1-second granularity, which reduces the instrumentation effort typical of self-hosted observability setups.
Key Features
- Automatic service discovery and dependency mapping across 300+ technologies
- All OpenTelemetry signals (traces, metrics, logs) generally available
- Real-time visibility with 1-second granularity
- Kubernetes monitoring: pods, containers, service mesh
- Self-hosted deployment option with on-premises installation
Pricing
Licensed by Managed Virtual Server (MVS). Logs from $0.35/GB. Minimum 10 hosts. Unlimited users. Fair-use: 325 GB per Standard SaaS MVS per month.
At 30TB/month: ~$10,500/month (range $10.5K-$37K)
Self-Hosted Assessment
- Data residency: Available with on-premises deployment. SaaS version is cloud-hosted.
- Operational overhead: Moderate to high – self-hosted Instana requires IBM-supported infrastructure and licensing
- Egress cost: Zero with self-hosted, standard egress with SaaS
Pros
- Automatic service discovery reduces instrumentation overhead.
- Self-hosted option for data residency requirements
- 1-second granularity for real-time visibility
- Strong hybrid/multi-cloud support
Cons
- Host-based MVS licensing (not per-GB); cost model differs from volume-based pricing
- Some agentic AI features still in preview
- Enterprise-oriented; minimum 10 hosts required
- Self-hosted deployment requires IBM infrastructure commitment.
10. Coralogix
Best for: Teams that want cost-controlled observability with data stored in their own cloud storage
Overview
Coralogix takes a hybrid approach to data residency: telemetry is processed through Coralogix’s SaaS control plane but stored in the customer’s own S3 bucket (or equivalent cloud storage) with infinite retention. This gives teams ownership of their data at rest without the full operational burden of self-hosting. The Streama engine processes data in-stream, which lets teams monitor significantly more telemetry than they index – a meaningful cost advantage at scale.
Key Features
- Streama engine: In-stream processing monitors 4x more data at lower cost by analyzing before indexing
- TCO Cost Optimizer: Routes critical logs to instant analysis, low-value to archive
- DataPrime query engine: Unified querying across logs, metrics, and traces
- 300+ integrations, OpenTelemetry native support
- APM, RUM, log analytics, infrastructure, SIEM, AI observability
Pricing
Unit-based ($1.50/unit). Logs $0.42/GB, Traces $0.16/GB, Metrics $0.05/GB. Data stored in customer’s S3 bucket with infinite retention. Unlimited users, hosts, and data sources.
At 30TB/month: ~$8,000-$14,000/month (varies by signal mix and indexing tier)
Self-Hosted Assessment
- Data residency: SaaS control plane with customer-owned cloud storage. Data at rest stays in your S3/GCS/Azure bucket.
- Operational overhead: Low to moderate – customer manages storage bucket, Coralogix manages processing
- Egress cost: Reduced (data flows to Coralogix for processing, but at-rest storage is yours)
Pros
- Customer-owned data storage with infinite retention
- Streama engine significantly reduces indexing costs.
- Unlimited users and hosts included
- Strong compliance certifications (SOC 2 Type II, ISO 27001, GDPR, HIPAA, PCI DSS)
Cons
- DataPrime is a proprietary query language (not PromQL or SQL).
- Unit-based pricing requires upfront planning to optimize.
- Not fully self-hosted; SaaS control plane with customer-owned storage
- Data in transit still flows through Coralogix processing layer.
Cost Comparison at 30TB/Month Ingestion
| Tool | Est. Cost @ 30TB/mo | Pricing Model | OTel Native | Data Residency | Self-Hosted |
| CubeAPM | ~$5,100/mo all-in | $0.15/GB ingestion-based | Native | Always (in-VPC) | Yes (vendor-managed) |
| Datadog | ~$30K-$45K+ | Host + feature-based | Partial* | SaaS only | No |
| Dynatrace | ~$20K-$35K+ | GiB-hour + commit | Partial | Managed option | Managed |
| Grafana Cloud | ~$15K-$20K+ | Usage-based | Native | If self-hosted | Yes |
| Elastic APM | ~$8K-$15K | Deployment-based | Partial | If self-hosted | Yes |
| Splunk | ~$35K-$60K+ | Host + module-based | Partial | SaaS only | No |
| Sentry | ~$15K-$32K | Event + usage | Partial | If self-hosted | Yes |
| Honeycomb | ~$5K-$24K | Usage-based | Native | Limited | Limited |
| IBM Instana | ~$10.5K-$37K | MVS-based | Partial | Self-hosted option | Yes |
| Coralogix | ~$8K-$14K | Unit-based | Native | Customer S3 bucket | Partial |
| New Relic (ref.) | ~$20K-$25K+ | Ingest + per-user | Partial | SaaS only | No |
* OTel metrics in Datadog are often billed as custom metrics. New Relic included as reference. All estimates use the methodology assumptions above. Vendor discounts and EDP commitments can significantly reduce SaaS costs.
What New Relic Actually Costs at Your Team Size
Most comparison guides show pricing tiers. What they do not show is how those tiers combine – data ingest + user seats + synthetics + cloud egress – into a real monthly bill.
| Team Profile | Data / Users | New Relic /mo | CubeAPM /mo | Annual Saving | Saving % |
| Small team | 500 GB, 3 users | ~$458 | ~$75 | ~$4,596/yr | ~84% |
| Growing team | 5 TB, 10 users | ~$4,955 | ~$750 | ~$50,460/yr | ~85% |
| Mid-market | 30 TB, 50 users | ~$24,745 | ~$4,500 | ~$242,940/yr | ~82% |
| Enterprise | 200 TB, 150 users | ~$97,750 | ~$30,000 | ~$813,000/yr | ~69% |
New Relic costs: Standard plan, Original data ($0.40/GB beyond 100GB free), full platform users at $99 to $349 per user per month for full platform access. CubeAPM: $0.15/GB, no user fees. Enterprise pricing may include negotiated discounts not reflected here.
If you want to model your current New Relic bill before committing to a switch, the New Relic pricing calculator breaks down every cost dimension: data ingest, user seats, synthetics, and cloud egress fees most teams overlook.
How to Migrate from New Relic to a Self-Hosted Platform
Migration anxiety is real – you have built dashboards, tuned alerts, and accumulated operational knowledge in New Relic over months or years. The good news: switching to an OpenTelemetry-native platform is structurally less painful than previous APM migrations. Once your services emit OTLP data, you can point that data at any compatible backend with a configuration change rather than re-instrumentation.
| Week | Focus | Key Actions | Exit Criteria |
| 1 | Instrument inventory | List every service using NR agents. Map data volumes per service. Choose target platform. | Full inventory. Platform selected. |
| 2 | Parallel run | Deploy OTel Collector alongside NR agents on 1-2 non-critical services. Dual-write telemetry. Compare dashboards. | Traces/metrics parity confirmed on pilot services. |
| 3 | Dashboard migration | Recreate top 10 critical dashboards and all active alerts. Validate alert accuracy. Remove NR agents from pilot services. | Critical dashboards live. Alert parity verified. |
| 4 | Full cutover | Roll OTel agents to remaining services. Cancel NR agents service-by-service. Run NR in read-only mode for 2 weeks. | All services on new platform. NR agents decommissioned. |
Practical note: Run both platforms simultaneously for at least two weeks before cancelling New Relic. Teams consistently discover dashboards they forgot existed, alerts that were silently firing, or integrations that depended on NR’s API. Document what each dashboard is measuring, not the NRQL syntax, before migrating.
Which Alternative Fits Your Self-Hosted Requirements?
- Choose CubeAPM if you need full data sovereignty with vendor-managed operations. Predictable $0.15/GB pricing, unlimited users, zero egress cost, and the vendor handles platform operations inside your VPC.
- Choose Grafana (self-hosted) if your team has dedicated SRE capacity to operate the LGTM stack at scale. Full data control, zero license cost, but significant operational investment.
- Choose Elastic APM (self-hosted) if you already run ELK and want to add distributed tracing without introducing another vendor. Requires Elasticsearch cluster management expertise.
- Choose IBM Instana if you need automatic service discovery across a complex hybrid/multi-cloud estate and want an on-premises deployment option from an enterprise vendor.
- Choose Sentry (self-hosted) if your team is developer-led, debugging from code inward, and needs self-hosted error monitoring with session replay.
- Choose Coralogix if you want data at rest in your own cloud storage without fully self-hosting. The Streama engine reduces indexing costs at scale.
- Choose Dynatrace Managed if enterprise AI automation and causal root-cause analysis justify the premium, and you need on-premises deployment.
- Choose Honeycomb if high-cardinality debugging and OTel-first tracing are your priority. Note that the private cloud option is still early.
- Choose Datadog if you need the broadest SaaS ecosystem and data residency is not a hard requirement. Model custom metrics costs before committing.
- Choose Splunk if you are already invested in Splunk SIEM and need full-fidelity observability from the same vendor. Budget accordingly.
When New Relic Is Still the Better Choice
New Relic remains the right choice for teams that want broad commercial observability in a single SaaS environment and do not have hard self-hosted or data residency requirements.
- If the free tier offering 100GB free per month is sufficient for your use case.
- You want one vendor covering APM, infrastructure, browser, synthetics, Kubernetes, and incident workflows in one place.
- You are already heavily invested in the New Relic ecosystem (dashboards, alerts, NRQL queries) and migration cost exceeds the pricing delta.
- You need native OTLP ingest inside a commercial SaaS platform without moving to a self-managed stack.
- You need mature synthetic monitoring with scripted browser/API tests and private locations.
- You are comfortable actively managing telemetry volume, CCU consumption, and ingest governance.
- You want AI-assisted observability (New Relic AI, alert-coverage analysis) built natively into the platform.
Final Thoughts
For teams with genuine data residency requirements, the field narrows quickly. Most observability platforms are SaaS-only – they cannot structurally satisfy compliance mandates that require telemetry to remain inside your infrastructure boundary. Regional data centers are not the same as in-VPC deployment, and the distinction matters when auditors review your architecture.
The cost argument for self-hosted observability goes beyond license savings. Cloud egress fees at 30TB/month add roughly $3,000/month to any external SaaS platform – a cost that does not appear on your observability invoice but compounds every month. Combined with per-user fees, custom metrics charges, and log indexing costs, the total cost of ownership gap between SaaS and self-hosted platforms is often larger than teams expect at scale.
The practical decision tree is straightforward. If compliance or data residency is a hard requirement, self-hosted platforms – whether vendor-managed, DIY open-source, or hybrid storage models – are the only viable path. If cost predictability matters more than feature breadth, platforms with single-dimension pricing eliminate the billing surprises that plague multi-axis models. If operational capacity is limited, vendor-managed self-hosted options reduce the DIY burden while keeping data in your VPC.
Compare your top two options against your actual telemetry volume, deployment constraints, and compliance requirements before making the switch. The numbers at your scale will make the decision clearer than any feature matrix.
Frequently Asked Questions
- Which New Relic alternative is best for self-hosted deployment?
Several platforms offer self-hosted options, but they differ significantly in operational burden. Vendor-managed self-hosted platforms handle upgrades and patches inside your VPC. Open-source stacks like Grafana LGTM give full control but require dedicated SRE resources. Elastic APM and Sentry also support self-hosted deployment. The right choice depends on your team’s operational capacity and compliance requirements.
- How much does cloud egress cost add to SaaS observability?
At 30TB/month, cloud providers charge approximately $0.10/GB for data leaving your VPC – roughly $3,000/month in egress fees, which does not appear on your observability invoice. This cost applies to every external SaaS platform and compounds with telemetry growth. Self-hosted platforms running inside your VPC eliminate this cost entirely.
- Can I migrate from New Relic without downtime?
Yes. The recommended approach is a parallel run: deploy the OpenTelemetry Collector alongside existing New Relic agents, dual-write telemetry to both platforms, and validate parity before cutting over. Most teams complete the migration in 2-4 weeks. Run both platforms simultaneously for at least two weeks before cancelling New Relic.
- What is the cheapest New Relic alternative at scale?
For teams beyond the free tier (1 user + 100GB/month), platforms with predictable per-GB pricing and no per-user fees offer the lowest total cost of ownership – particularly when cloud egress savings are included. At 30TB/month, the gap between single-dimension pricing and multi-axis billing models can exceed $15,000-$20,000/month.
- Is Datadog a good self-hosted alternative to New Relic?
No. Datadog is SaaS-only with no self-hosted option. For teams with data residency requirements, Datadog does not solve the architectural constraint. It is included in this comparison as important context for pricing and feature breadth, but teams needing in-VPC deployment should evaluate self-hosted or vendor-managed platforms.
- What is the difference between vendor-managed self-hosted and DIY self-hosted?
Vendor-managed self-hosted platforms deploy inside your VPC, but the vendor handles upgrades, patches, and platform operations. DIY self-hosted means your team runs everything – capacity planning, upgrades, troubleshooting, and scaling. The data residency benefit is the same; the operational burden is fundamentally different.
- Does Coralogix count as self-hosted?
Partially. Coralogix processes telemetry through its SaaS control plane but stores data at rest in your own cloud storage (S3, GCS, or Azure). This gives you ownership of data at rest and infinite retention, but data in transit still flows through Coralogix. For teams where data-at-rest residency satisfies compliance requirements, this hybrid model can work. For teams requiring end-to-end in-VPC processing, it does not.


Leave a Reply